Sunday, September 1, 2013

Data Processing with Pig : Understanding PIG functions


In this tutorial we would try to explore some functions for data processing and learn them by example. We would be using PIG script to find out the Maximum runs scored by a player from a baseball stat data. You can download the sample file from http://seanlahman.com/files/database/lahman591-csv.zip.

It’s a collection of files having information about baseball stats while if you unzip this you would have number of files we will be using “Batting.csv”  in this tutorial.
Prerequisite: To understand this tutorial you should have a basic knowledge about PIG and loading file into H-Catalog. Please visit below URL for more details

Steps:

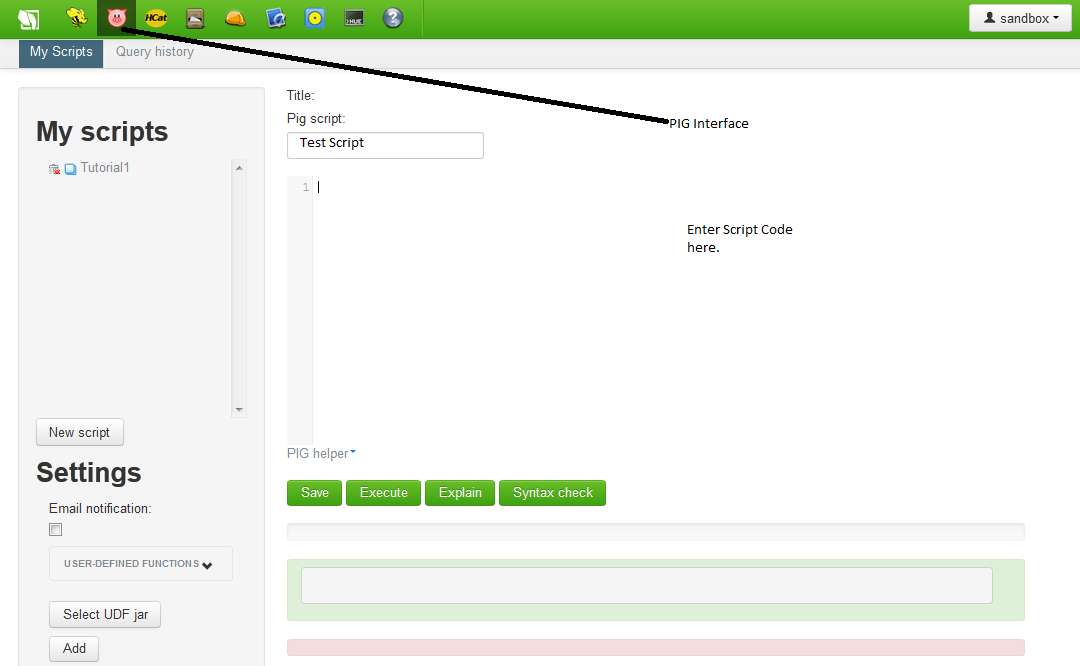
1.       Logon to Hadoop console and Click on “PIG” Icon and Click “New Script”.
2.       Write down the code below in the editing area
a)      batting = load 'Batting.csv' using PigStorage(','); 
b)      runs = FOREACH batting GENERATE $0 as playerID, $1 as year , $8 as runs; 
c)       grp_data = GROUP runs by (year); 
d)      max_runs = FOREACH grp_data GENERATE group as grp , MAX(runs.runs) as max_runs;
e)      join_max_run = JOIN max_runs by ($0, max_runs), runs by (year,runs);
f)       join_data = FOREACH join_max_run GENERATE $0 as year, $2 as playerID, $1 as runs;
g)      dump join_data;
3.       Click on “Save”.
Now let’s try to understand code line by line and keep in mind what we want to do is to find out the Max score done by a player in any year.
batting = load 'Batting.csv' using PigStorage(',');   
This is pretty simple we just want to load one file using PigStorage() function it will load the file structure into “batting” variable ( an array actually).
runs = FOREACH batting GENERATE $0 as playerID, $1 as year , $8 as runs; 
Now here we just want to extract those columns which are useful for us into a separate array you can see that data is accessed based on the $index as first index in Batting.csv contain PlayerId ( name) and 8th index contains the score done by player.
grp_data = GROUP runs by (year); 
GROUP function only groups data into chunks based on the column we specify in our case the data groups will be created based on YEAR which means all records that belongs to one year will be stored together in ONE ROW. If you want to understand it better execute below in PIG editir area
DESCRIBE grp_data;   // Results of this statement is below
grp_data: {group: bytearray,runs: {(playerID: bytearray,year: bytearray,runs: bytearray)}}
This is how GROUP looks like and if you look at that 'group' is the name of first column by default n will contain the "year" value as defined in GROUP BY clause.
The second column is an Object which means you will have records which falls in this group. e.g in this year.
max_runs = FOREACH grp_data GENERATE group as grp , MAX(runs.runs) as max_runs;
Now for each year it will calculate the MAX runs scored.
join_max_run = JOIN max_runs by ($0, max_runs), runs by (year,runs);
JOIN works in similar fashion as it does in SQL it is joining the $0 (Year) and max runs ( line d)  with Year and Runs with “runs” ( line b in code) array. 

In SQL terms the join is as follow
Max_runs inner join
Runs on  Max_runs.Year = runs.year
And Max_runs.max_runs = runs.runs;

join_data = FOREACH join_max_run GENERATE $0 as year, $2 as playerID, $1 as runs;
This last statement just generate a new final dataset by extracting Year , Player Name and MAX runs scored from the joined data set.
The final output of this program is as follows
(1871,barnero01,66.0)
(1872,eggleda01,94.0)
(1873,barnero01,125.0)
(1874,mcveyca01,91.0)
(1875,barnero01,115.0)
(1876,barnero01,126.0)

Thanks
 

Thursday, August 29, 2013

Alter Table Vs Ins Select for Modifying Table Structure in Teradata


Conclusion

It is strongly recommend implementing Alter Table, at least start considering it. If you're concerned about availability you should bear in mind that this process will probably be scheduled out of business hours anyway.
And when you need to change the [P]PI or you just want the safeness of a copy of the old table you should definitely prefer Merge Into over good ol' Insert Select.

Please review below figure to see the Pros and Cons of using Alter/Insert Selct and Merge into options for modifying any table in Teradata.


The above conclusion is based on Dieter Blog reference link for details is as follows

http://developer.teradata.com/blog/dnoeth/2013/08/why-dont-you-use-alter-table-to-alter-a-table


Wednesday, August 28, 2013

Dynamic DDL Generation using BTEQ


Dynamic script can be generated using Teradata DBC tables. we would use dbc.tables to generate the DDL of all objects available in development database and later we can change that script to deploy to Test or any other environment.

You can use below BTEQ script which will actually generate the standard SHOW TABLE ; statement for all objects in development database and results will be exported to Prepare_DDL.BTEQ .

 .SET ERROROUT STDOUT
.logon 10.16.X.X/tdusre,tduserpwd
.Set Echoreq off
.Set Titledashes off
.Set Separator '|'
.Set Format off
.set width 5000
.Set Null ''
 .export file=.\Prepare_DDL.BTEQ;
       select distinct 'SHOW TABLE ' ||  TRIM(databasename) || '.' || TRIM(tablename) || ';'
from dbc.tables
where tablekind =t' and databasename in
(
'DD_DEV_ENV'

);

.export reset;
  
.Logoff;
.Quit;

You can invoke this BTEQ on command prompt as  "Bteq < Bteq_filename > FileName.logs

In next step you can open up  Prepare_DDL.BTEQ and modify it as above to execute that will give you all table DDL;s in one file. The modified file will look like as follows


.SET ERROROUT STDOUT
.logon 10.16.X.X/tdusre,tduserpwd
.Set Echoreq off
.Set Titledashes off
.Set Separator '|'
.Set Format off
.Set Null ''
.set width 5000
.export file=.\Generated_DDL.sql;

SHOW TABLE  DD_DEV_ENV.ACTION_TYPE;
SHOW TABLE  DD_DEV_ENV.BARRING;
...........
......
......
 .export reset;
 .Logoff;
.Quit;

The final exported file "Generated_DDL.sql" will have all the Create table statements which you can modify /parametrized and use to migrate to any other environment.

Thanks

Thursday, August 22, 2013

Hadoop : Getting Started with PIG

In this tutorial lets get started to learn some basics about PIG. If you recall from previous tutorial PIG is a script based utility to write transformations e.g Agg , Join etc similar to SQL it is for people who are more comfortable in SQL then Java. But you can also make UDF for complex transformation which are written in Java and called directly in PIG.

If you are new to Hadoop please go through http://tahir-aziz.blogspot.com/2013/07/introduction-to-big-data-and-hadoop.html

Our current case study which we want to implement is a very simple example we want to compuet the average Stock Volume for IBM company .From last tutrial we loaded the Stock exchange data and we would use the same to complete this.

Refer to the blog to http://tahir-aziz.blogspot.com/2013/08/getting-started-with-hadooploading-data.html

To write our first PIG script follow below steps.

  1.  Login to your Horton Sandbox and on Main screen Click on "Pig" icon. Refer to diagram below
  2.  You can create your first script by entering the Script Name and in the middle of the screen you can see Editor where you should actually code the logic. 
  3.  Enter below script into Editing Area  
  4. A = LOAD 'nyse_stocks_t' USING org.apache.hcatalog.pig.HCatLoader();  // Load the file into a variable A but make a note that the file should be first loaded using File Uploader at  /User/SandBox.
    B = FILTER A BY stock_symbol == 'IBM'; // Filter data for IBM only
    C = GROUP B all;  // Simple Group by function on ALL columns
    D = FOREACH C GENERATE AVG(B.stock_volume);  // Iterate records to calculate Average using AVG function.
    dump D;
  5. Click on "Save" to save this script to sandbox. 
  6. Later you can Open the script and "Execute" to make sure it works fine.  The expected result is
    (7915934.0)
 Hope that helps you get started.

Thanks

Tahir Aziz

Tuesday, August 20, 2013

Getting Started with Hadoop:Loading Data using Hcatalog/Hive


In this tutorial we will get started to load data into Horton Hadoop .We would explain step by step instructions to load data using Hcatalog and will later use Hive and do simple data manipulation on the loaded data using HIVE SQL.
 

Refer to http://tahir-aziz.blogspot.com/2013/07/introduction-to-big-data-and-hadoop.html if you are new to Hadoop and need more basic information.

Loading Data using HIVE


You can load sample data into Hadoop using File Explorer or Hive Directly. Let’s use Hive UI interface to create a table using File as input. For this example we are going to use the sample file available at Hadoop website (Download this file and save at your disk)


Follow below steps to create table from file and load data into target table.
-        

1.       Click on “HCatalog Icon” and Click on “Create a new table from File.  (See Fig below).


2.       Fill the required details enter Table name, Description and chose to upload file which you have saved on your disk.


3.       Click Next and on  next step “Choose Delimiter” Chose the delimiter for this sample file it’s  TAB but other options are also available if your file delimiter is something else e.g. comma , Pipe etc. 

4.       Click Next and on next step “Define Columns” Check the data types by default it treats everything as string you can change the data type to suitable data type as per the column contents. E.g. in our current example file stock_price_high, stock_price_low etc are good candidates to be handled as float so change it. 

5.       Once you are done the process will create table and will also load the table with the file which you have just selected in above steps. 


So what is next now? Let’s check the data content using the HIVE SQL and verify if the contents are loaded properly and all data types are OK. 

Click on Hive UI and you will see an interface where you can enter your query and execute them.
To check if the table has been created and what are the data types you can enter your query as 

describe nyse_stocks_t;

It will display the column names and data type of the columns. 

Now let’s try to do a simple manipulation let’s say we want to calculate the average of Stock volume for IBM. HIVE SQL is similar to standard SQL and supports almost all SQL aggregations. You can write below HIVE SQL to calculate the average. 

select AVG(stock_volume) from nyse_stocks_t
where stock_symbol == 'IBM';

This will return the Average for IBM. 

Hope you learned the basics.

Thanks

Tahir Aziz

Friday, August 2, 2013

Push down Optimization - Informatica


Pushdown Optimization Option enables data transformation processing, to be pushed down into any relational database to make the best use of database processing power. It converts the transformation logic into SQL statements, which can directly execute on database. This minimizes the need of moving data between servers and utilizes the power of database engine. 

There are three main types of Push down 
  1. Source-side pushdown optimization
  2. Target-side pushdown optimization 
  3. Full pushdown optimization 
To read more about PDO and configurations please refer to below very use ful article.


http://www.disoln.org/2013/07/Informatica-PowerCenter-Pushdown-Optimization-an-ELT-Approach.html?goback=%2Egde_1690897_member_262700329

Thanks

Friday, July 26, 2013

Partitioning in Informatica

A very to the point use case to understand the Partitioning in Informatica and configuration settings to make it work.

In Informatica you can use different types of partition algorithms  listed below

-Pass Through
-Round robin
-Hash AutoKey
-Key Range
-Hash user Key
-Database Partition

http://www.disoln.org/2013/07/Informatica-PowerCenter-Partitioning-When-Where-and-How.html?goback=.gde_1690897_member_260653409

Thanks

Tuesday, July 16, 2013

Load Balancing In Informatica

A Very useful article to explain about the Load balancing in Informatica.

http://ptlshivakumar.blogspot.in/2013/07/load-balancing-in-informatica.html?goback=.gde_37180_member_257933343

Thanks

Monday, July 15, 2013

Introduction to Big Data and Hadoop

Hi , so today we would like to cover some of the basis about Big Data analytics and how you can learn about it. we would also look at the Open source stable version to play around with Hadoop and get some hands on experience.

Big Data : What is Big data ?

Now you may encounter many definations about Big Data but the short and to the point defination is where your data volume is large and your typical database processing on that data set do not meet business response time lines.  

so its not only about the volume of the data its more about the processing time it takes to produce any value.

Get Started : Where do I start?

Now where should one get started if you are interested in knowing it and want to explore more ? you may have often heard about Hadoop. Horton works is providing an open source stable version of Hadoop which you can easily install on your machine and start playing around.

Download Link : http://hortonworks.com/get-started/

Hadoop Architecture 

Hadoop comes with a lot of components you can view list of available components in Horton Hadoop below.


Below is a very brief and to the point description of each of these components.


SCOOP : Its a utility in apache hadoop to move data from SQL database into hadoop.

PIG :  A script based utility to write transformations e.g Agg , Join etc similar to SQL it is for people who are more comfortable in SQL then Java. But you can also make UDF for complex transformation which are written in Java and called directly in PIG.

Hive : Its an SQL interface for Hadoop and is used for data analysis can connect to any other source with ODBC drivers e,g Excel , MStr , other data storagtres etc. The language is caled HQL (Hive Query Language) same as like SQL.

H-Base :  NO SQL Database for Hadoop

H-Catalog : Metadata about the hadoop database.

AMBARI : Ambari enables you to manage, monitor and install your cluste
OOZIE : Its Hadoop schedular and can schedule jobs which you will develop in PIG /Hive  or Scoop.

Where does Hadoop fit in the Enterprise Model ? 

Hadoop is actually to deliver the best and quick Analytics it is NOT replacement of the existing DWH or OLTP systems. It can consume information and can help you achive your target SLA with gicing you a capability to perform analytics on Non-Structures ,Semi structured data sets. 


Thanks


Tuesday, July 9, 2013

Exporting Data From Oracle to Flat File


Hi here's an example of how an sqlplus  export script should look if you would like to export data from Oracle to a flat file .

------
set colsep |     -- separate columns with a "|" character
set headsep off  -- remove heading separators
set linesize 1000   -- line size set to 1000 or whatever your maximum length is
set numw 20       -- 20 is the length of numbers, you set this at whatever length you want your numbers to be. This should also avoid getting numbers in scientific notations such as 1.77382E... etc.
set pagesize 0   -- no headers
set trimspool on -- get rid of trailing blanks set echo off -- so you don't get the data on the screen that slows down the process significantly... if you want to monitor the file you can use the unix command tail -f /usr/loadfiles/loadfile1.dat set feedback off -- no messages

spool /usr/loadfiles/loadfile1.dat -- location where the flat file will be exported... You might have to convert dates, numbers etc. to varchars

select col1,col2,col3,... from tableX  where ... ; -- query for downloading the data... You can put here your "latest data" vs. "cold data" filtering conditions etc.

spool off
exit
------

If you want everything into a single line you can use the concatenate query (without trailing blanks after every column): select col1|| '|' ||col2|| '|' ||col3,... from tableX  where ... In that case you don't need the "set colsep... statement). There are many ways of specifying the query. Also (this is trivial, but worth mentioning) be sure you have enough space and write permissions in the file system you are exporting the file.

You put the text between the two "------" into a file called (for example) script.sql or something similar, then run from the unix prompt as follows:

unix prompt> sqlplus username/password@oracle_connection @script.sql


You can put multiple sqlplus statements into a unix shell script for exporting from multimple sources/tables. Be aware that I did not test this, so you will have to experiment a bit in your specific environment, but it should give you a good conceptual idea on how to do it...